ReefTrace graphs my parameters over time
Using the ReefTrace app to track all my water parameters, I've been entering in quite a few data points over a period of many months. Today I decided to use the Compare option and selectively worked my way through each test, and I set the Date parameter from Jan 1, 2017 until today. That was easier than trying to remember when I entered various test results.
I should add that if I'd been a really responsible hobbyist, I would have had results for every test every week. Alas, I do not. And that is why I keep talking about posting our results on Instagram to help me be better about measuring my water regularly. Do keep in mind that there are times I test one thing such as Phosphate or Alkalinity, merely out of concern and not on my normal testing day (Saturday); those don't get entered into the app. Overall, I definitely could do better in this area.
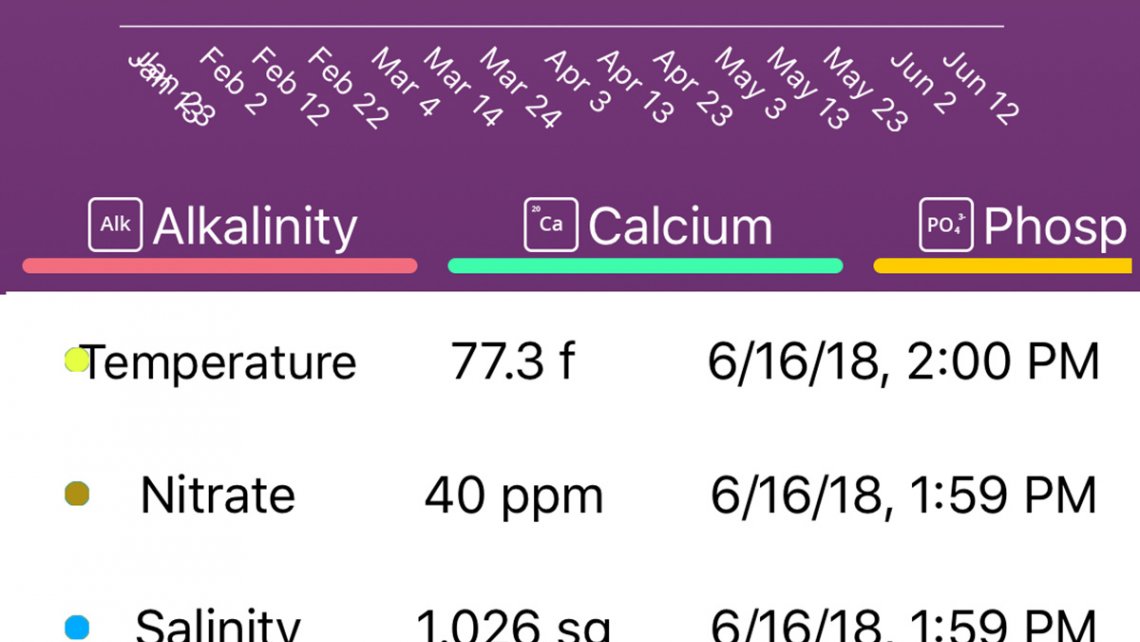
So here's today's barrage of tests, as listed in the app when it is first opened. If you've never done a test, you'll see a graphic instead. It should always show you the most recent results. You can scroll this up and down if you have quite a few entries.
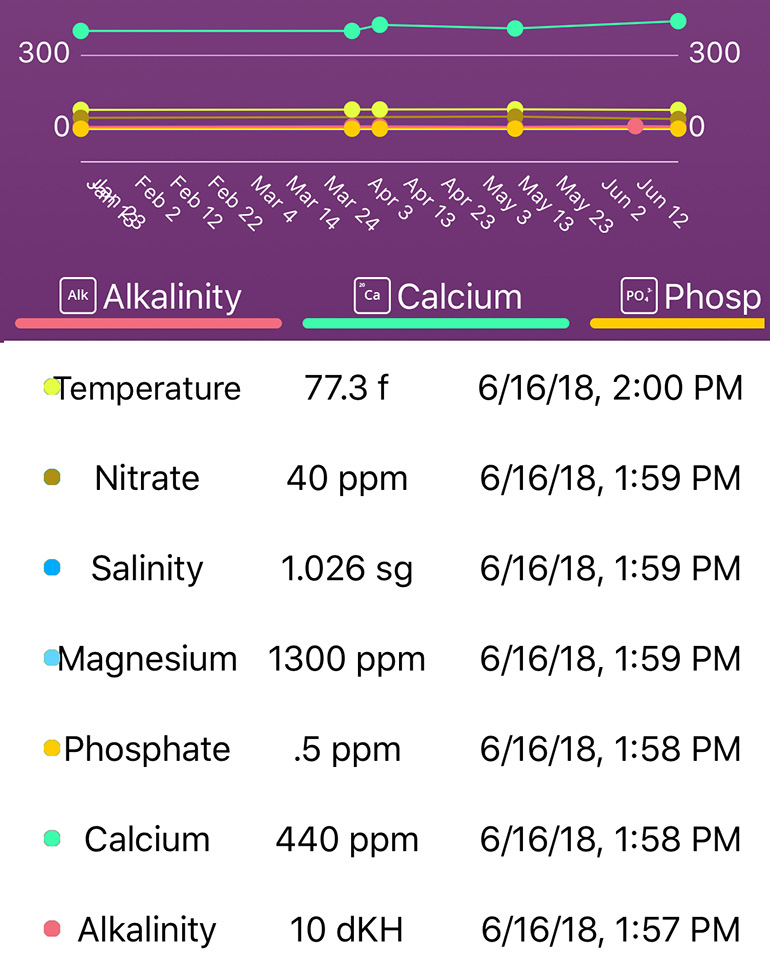
Underneath that list, the word Compare appears. You can then select as many different tests as you want to graph at the same time, or just a single one. Usually if you select several, the graph isn't all that useful because the parameters are far apart (Phosphate is close to 0, pH is over 8, Magnesium is over 1200). It just doesn't chart well. However, if you select only one test result, and then set the date period to cover a few weeks or months, you'll see the below. I chose Alkalinity first.
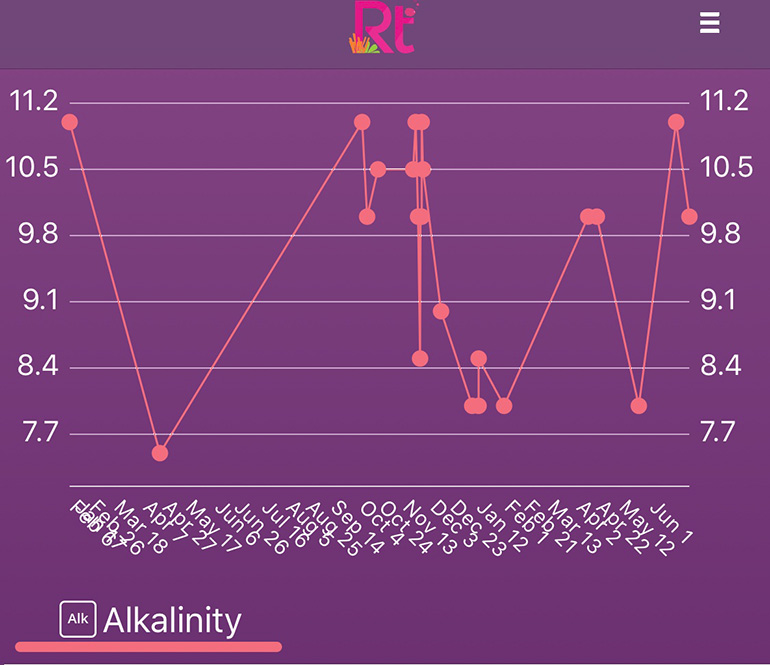
This graph starts February 2017 and ended today, June 17, 2018. You can see a bunch of months that never had a single entry. :( You also can see the range, which bounced around from as low to 6 all the way up to 11 dKH. What's missing is last year's event when my tank was way up at 22 dKH and I had to bring it down gradually over a period of three or four months until I got it down to the 10 range. By doing this slowly, my livestock didn't suffer any shock and corals simply adapted rather than die off. Under the graph, here are my data points:
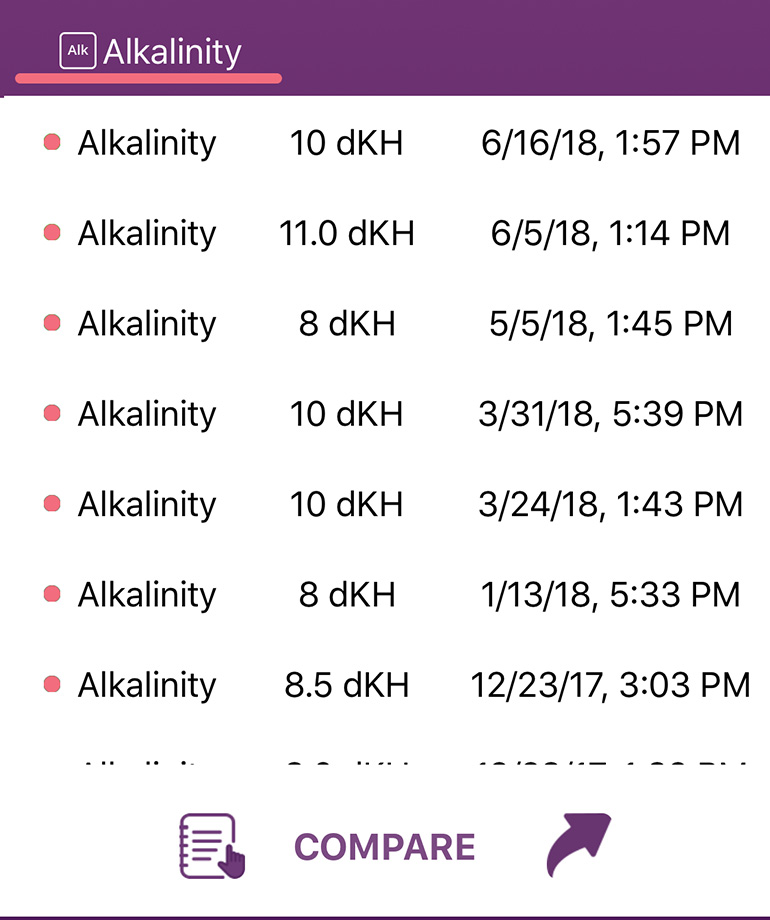
This list is scrollable, up and down to look at previous entries. These can be edited or even deleted, if desired.
There's a notebook icon, which you can tap to see natural reef parameters (NSW), parameters I recommend, and the averages from the data users enter across the ReefTrace network.
Now that you know what I was doing, I just show you some more of the graphs I viewed:
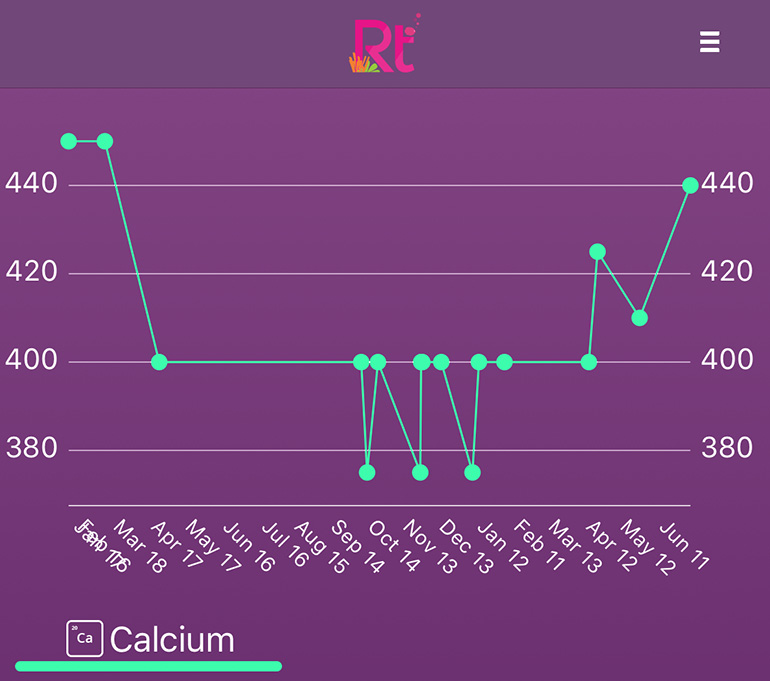
Calcium doesn't wander much in my system. 375 - 425ppm is acceptable, and most of the time it measures right at 400ppm.
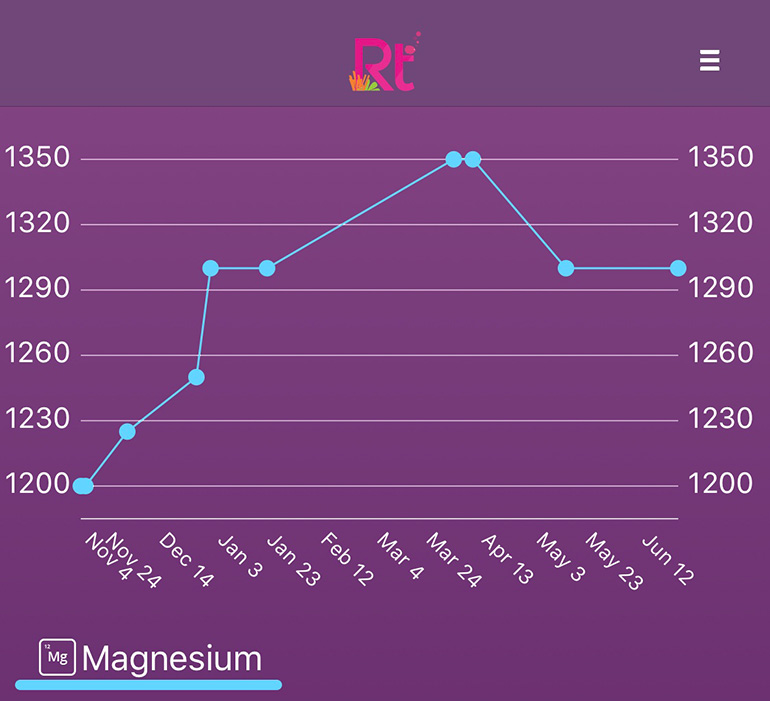
Magnesium is one that takes a lot of product to bring it up. Today it measured 1300ppm. I add roughly 1-gallon of Mg to my reef every month.
Nitrate has been an issue for the past year. Today it measured 40ppm. No screenshot of nitrate was saved.
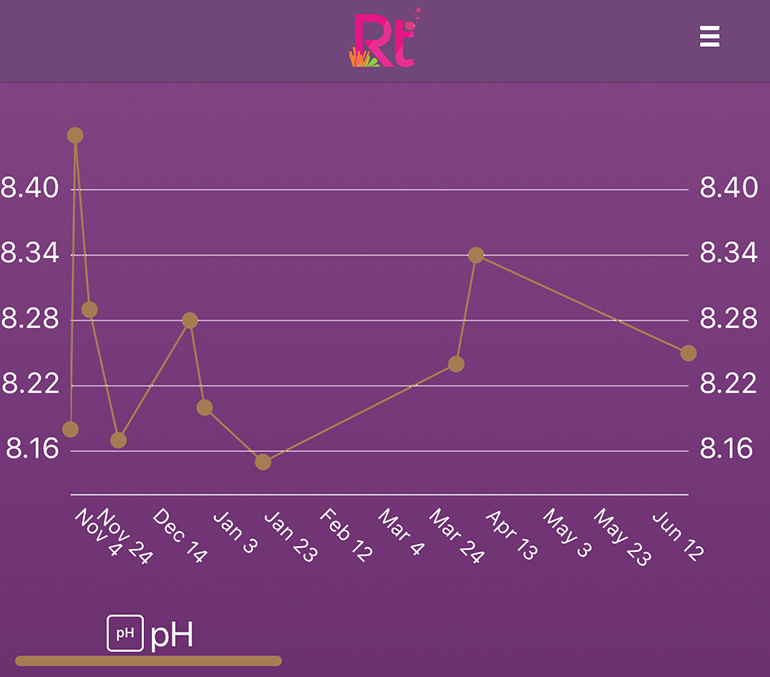
Below are my pH readings that I logged into the app. My Apex controller tracks pH around the clock and provides a very detailed graph, compared to this manual-entry method.
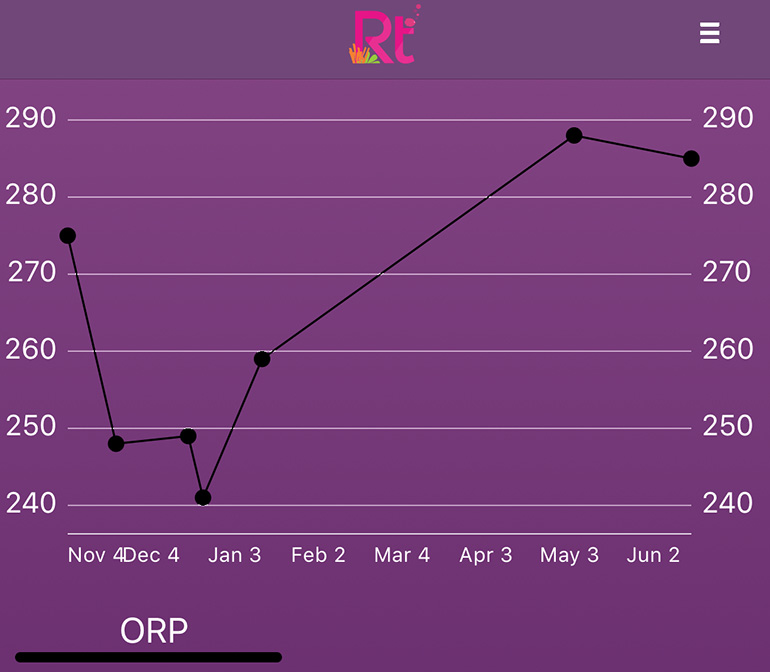
Like pH, ORP is also tracked by the Apex. These are numbers I logged on those water testing Saturdays. I don't watch ORP much at all, honestly.
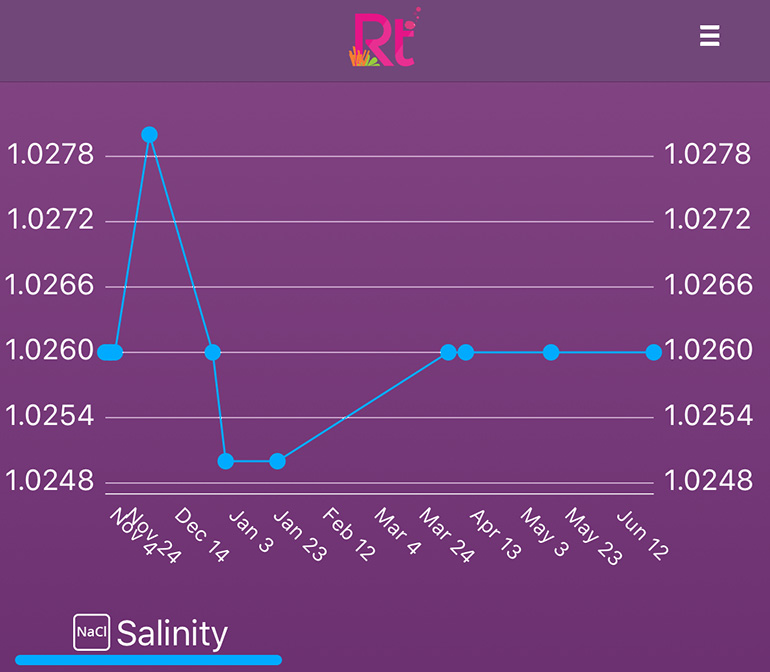
Salinity is a good one to keep track of. I test this with a digital refractometer, and I always do this three times in a row before I log an entry, to make sure I'm getting the same reading. It takes 10 seconds to check it, so I don't mind doing it three times. That one entry way back in November, the tank measured 1.028sg, so it makes this graph look a little more dramatic than it really was.
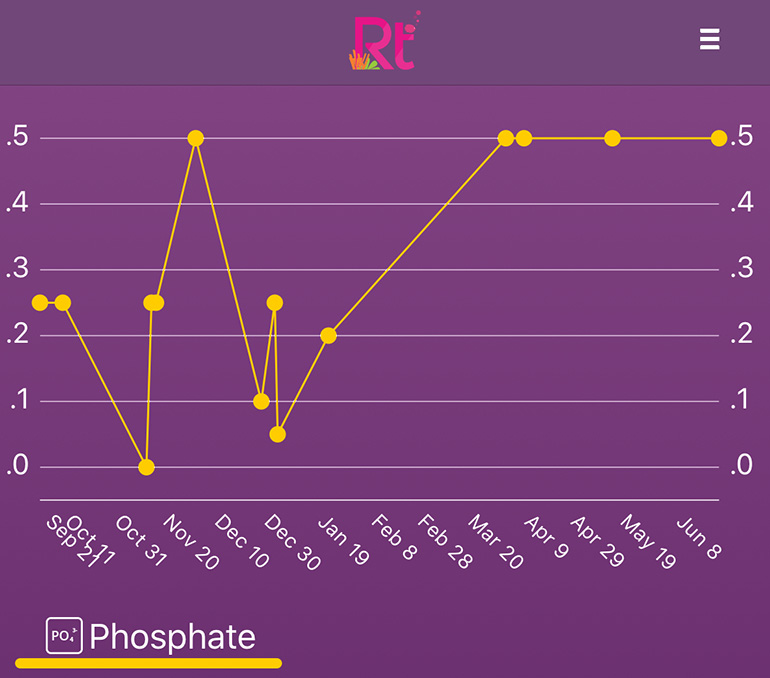
Speaking of funny graphs, let's look at Phosphate. It looks like I can't get that number to come down in that graph, but the reality is that when the number reaches .25ppm to .5ppm, I'll dose the tank with Phosphate Rx to bring it down. I don't retest after dosing, so you don't see a lower test results. It will then rise up gradually, and when I'm testing the number is up again. Bottom line, not a big deal. My reef does quite well even with this much phosphate in it, but I see less algae on the glass daily when the PO4 level is lower. I'll dose my tank again this week with Phosphate Rx.
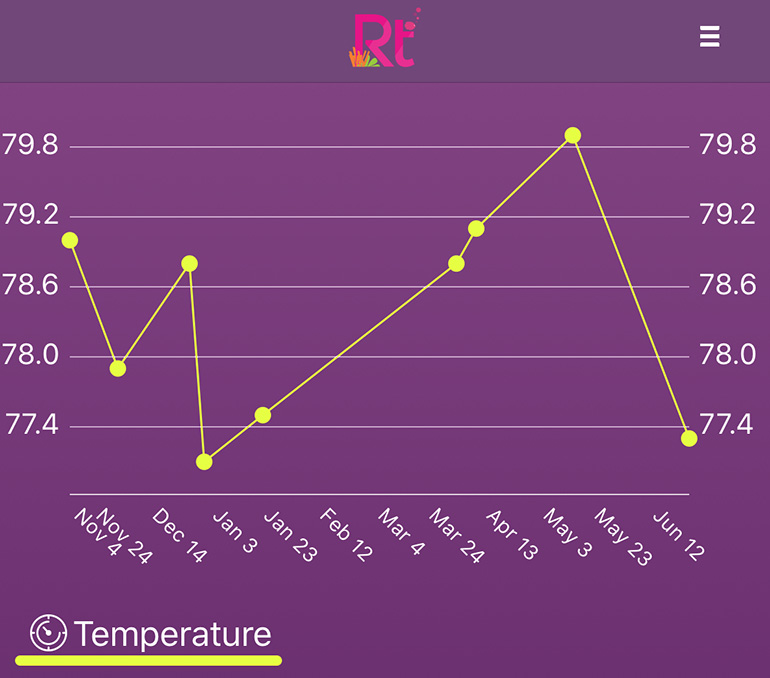
Here are some Temperature readings I logged, but again the Apex tracks this around the clock and provides graphs to watch for trends.
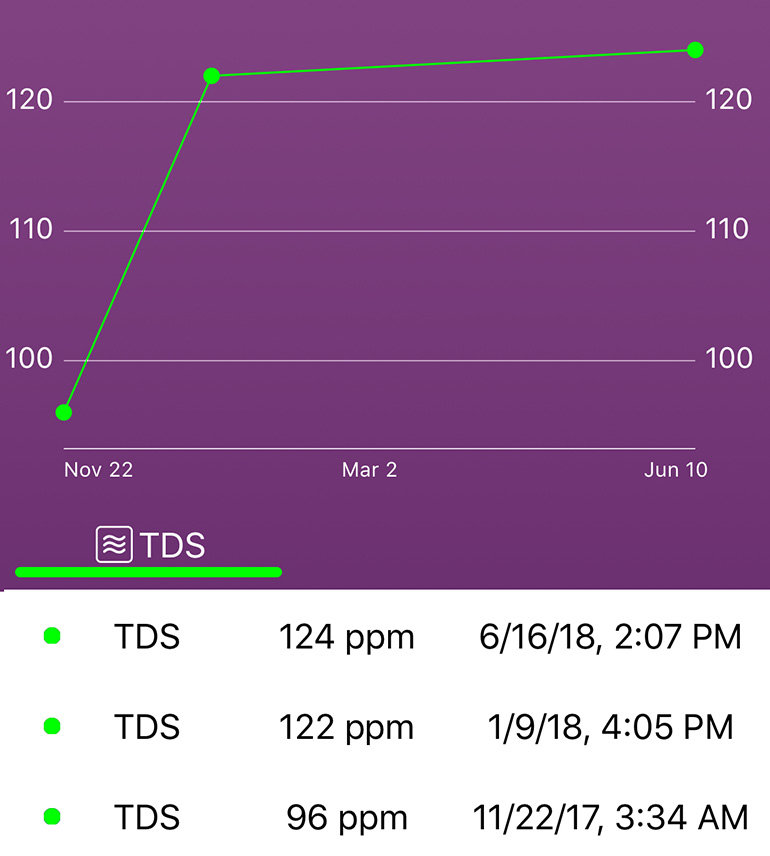
Lastly, here's my SOURCE WATER TDS reading. I think we should check this every few months, log it in ReefTrace and that way we collectively can help build a database of TDS levels across the nation, seasonally. What's your source water's TDS this month?
It's nice to review the various trends of your water testing throughout the year, and the more tests you log, the better the graphs. I hope to post better ones in the future. :)